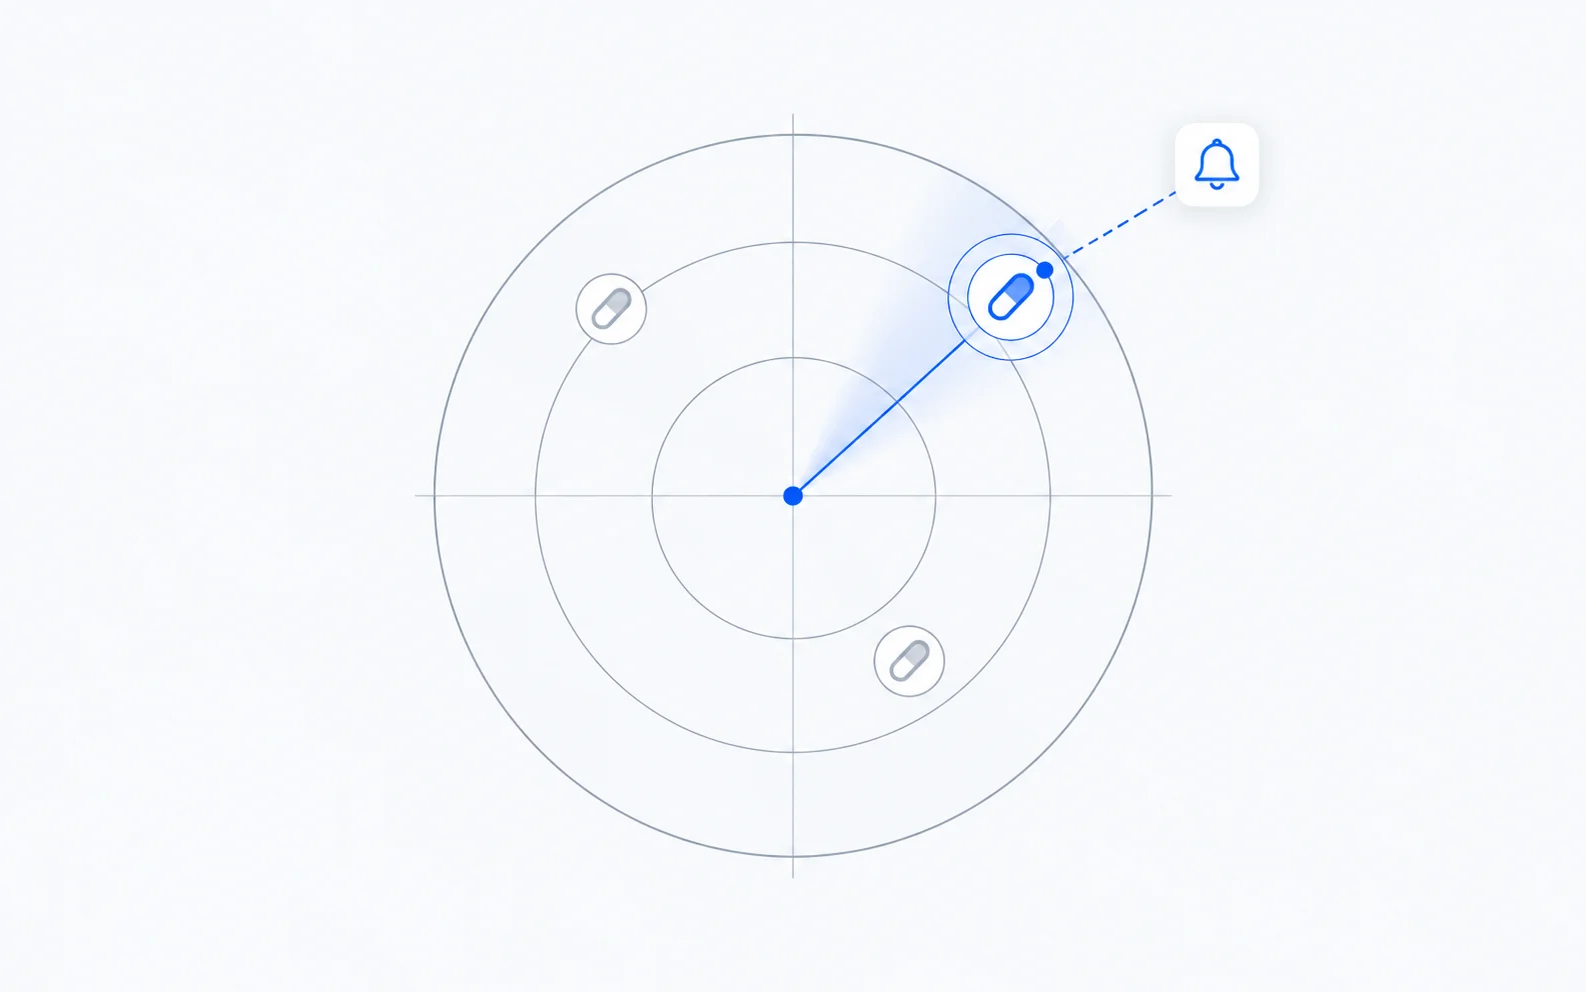
Ask the market question. Get the ranked answer.
Each view starts from a question your team already asks every week, not from an empty table.
Five views built for drug market work
Each one joins FDA and CMS files that normally sit in separate downloads, and exports to Excel.
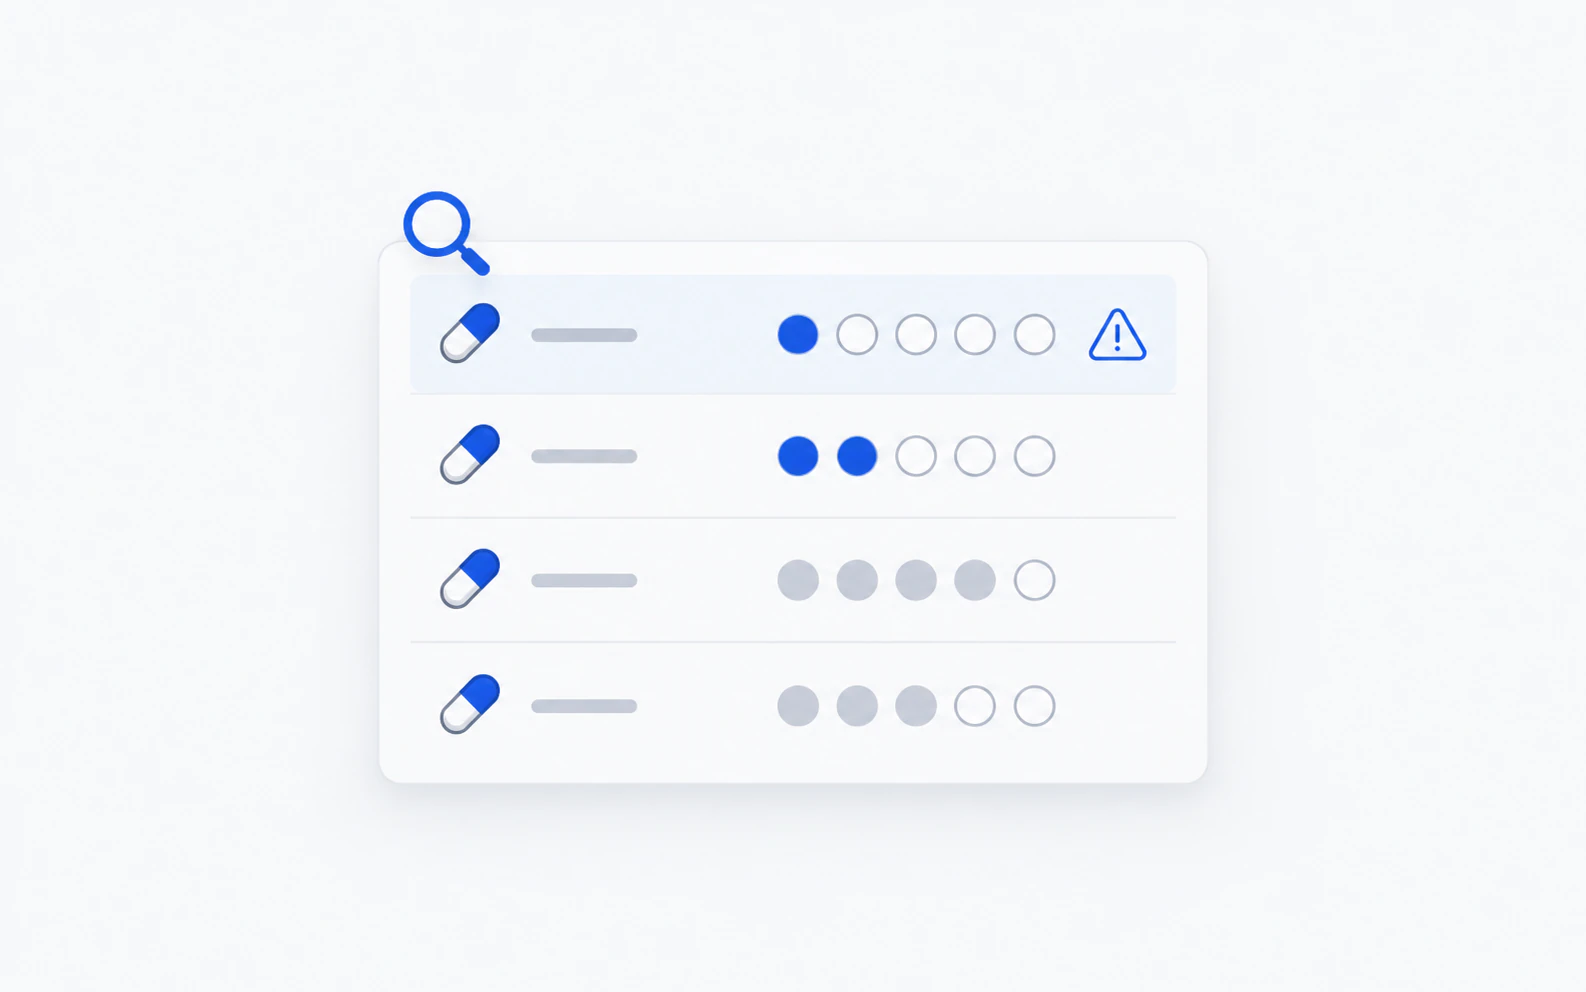
See every brand losing protection, ranked by what it is worth
When each brand's last patent or FDA exclusivity lapses, how many generics are already waiting, and the Part D revenue that opens up when it goes.
- Scored opportunities: exposure x whitespace x urgency
- Supply-gap openings: active shortage plus lapsing protection
- Switch targets: the prescribers to call for a competing brand
- Biologic cliff: 12-year BPCIA exclusivity ending
One page per drug, instead of eight separate tables
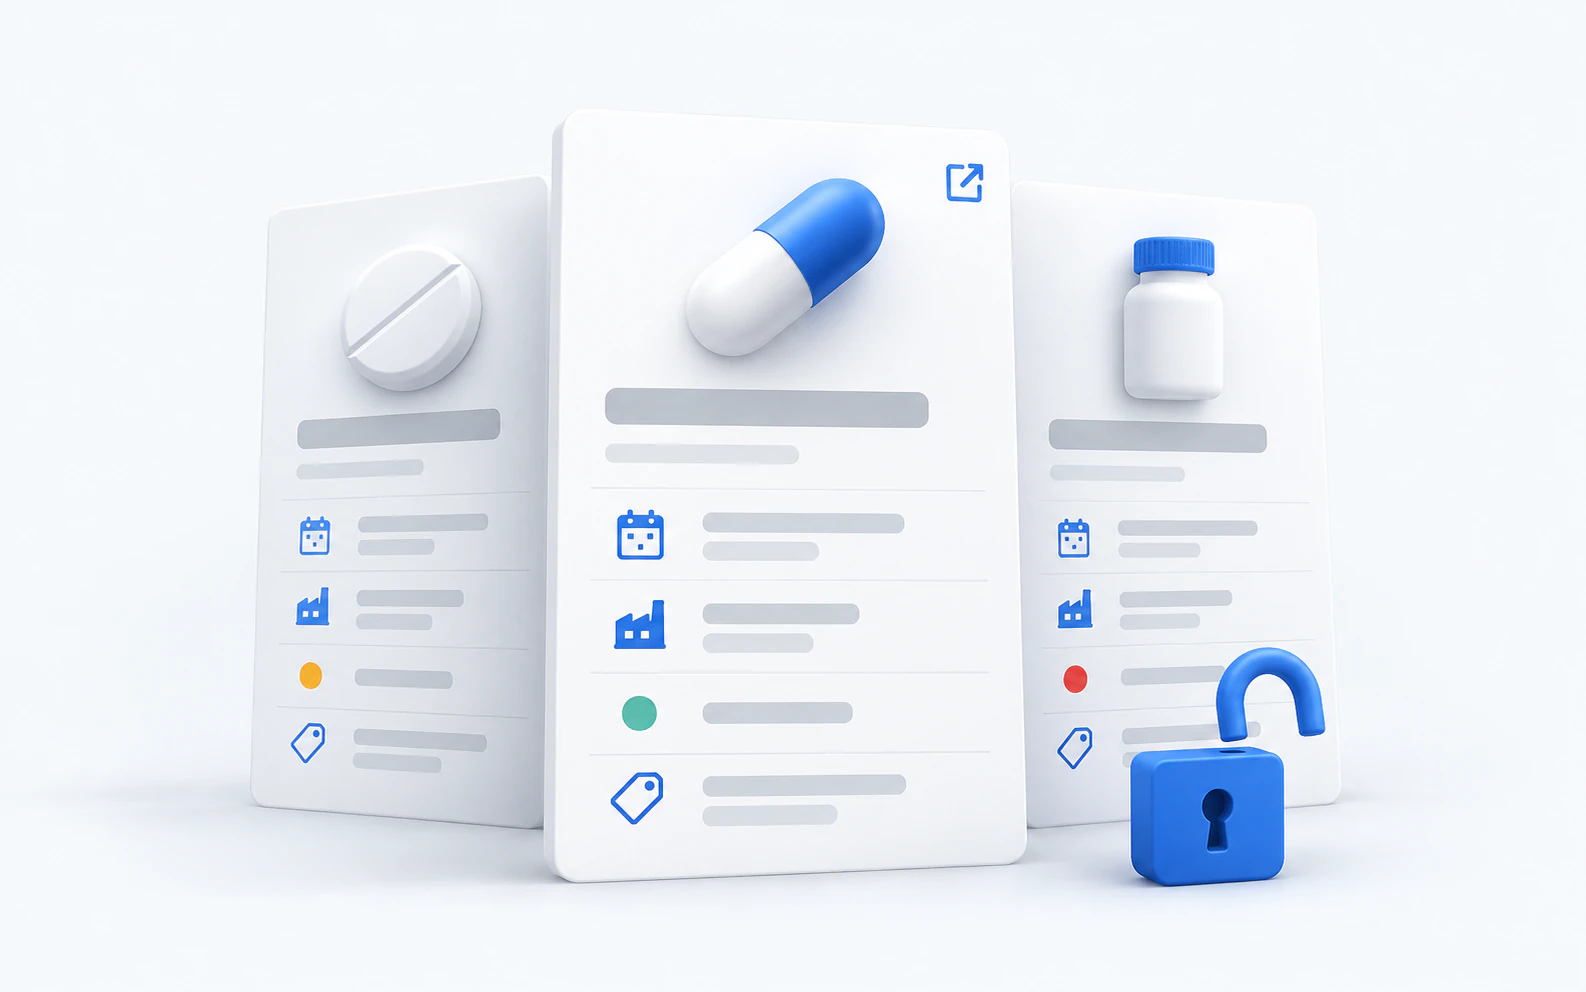
Type a brand or molecule. QOPE unifies its generic-competition signal, exclusivity timeline, supply status, pricing and biologic listings into one profile with a verdict.
Who is short, for how long, and who can fill the gap
Every record on the FDA shortage file, joined to the Orange Book supplier base, Medicare Part D demand and Medicaid rebate exits. Discontinuation notices are kept apart from real shortages.
Know the day a market changes
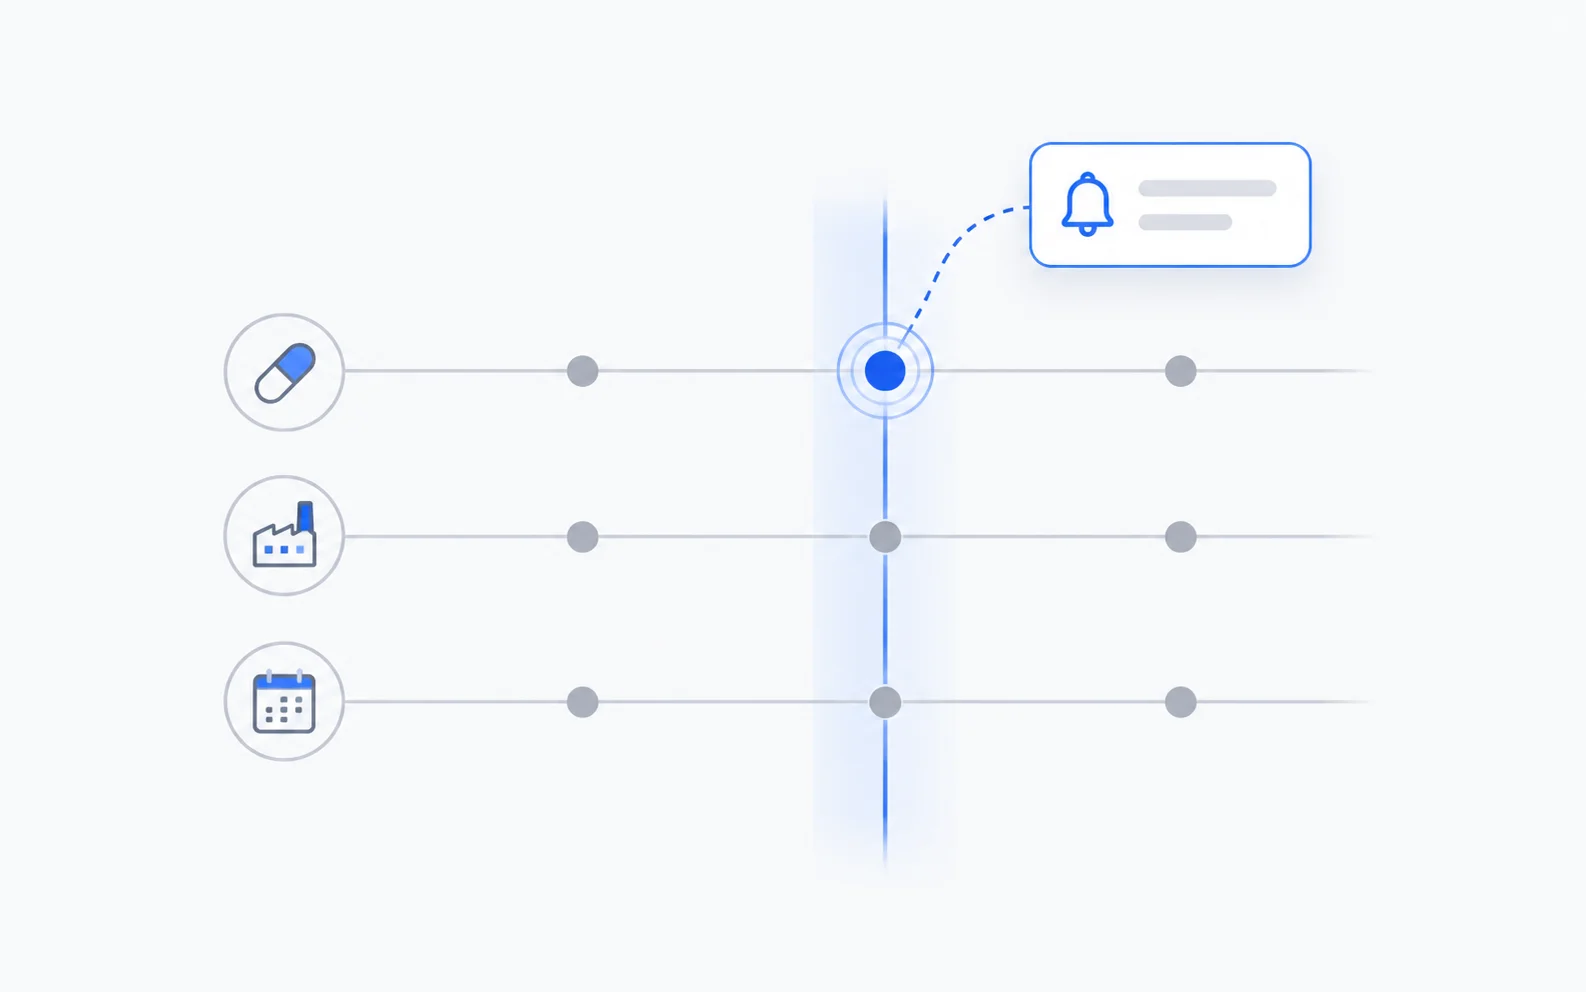
Watch drugs, makers, markets and counties. Radar checks twice a day and confirms a change on two scans before it alerts you.
- First generic or biosimilar competition
- An active FDA shortage or a Class I recall
- Protection expiring, or a cliff date moving by more than 90 days
- Instant email alerts and a Monday digest on Pro and Teams
See the brand-to-generic gap before you price
CMS NADAC acquisition cost per presentation, the generic switch opportunity for each brand, and a price erosion atlas that shows how far prices fall as generic sellers arrive.
- Generic switch opportunity per brand
- Per-presentation acquisition cost
- Biggest brand-to-generic gaps and priciest drugs to acquire
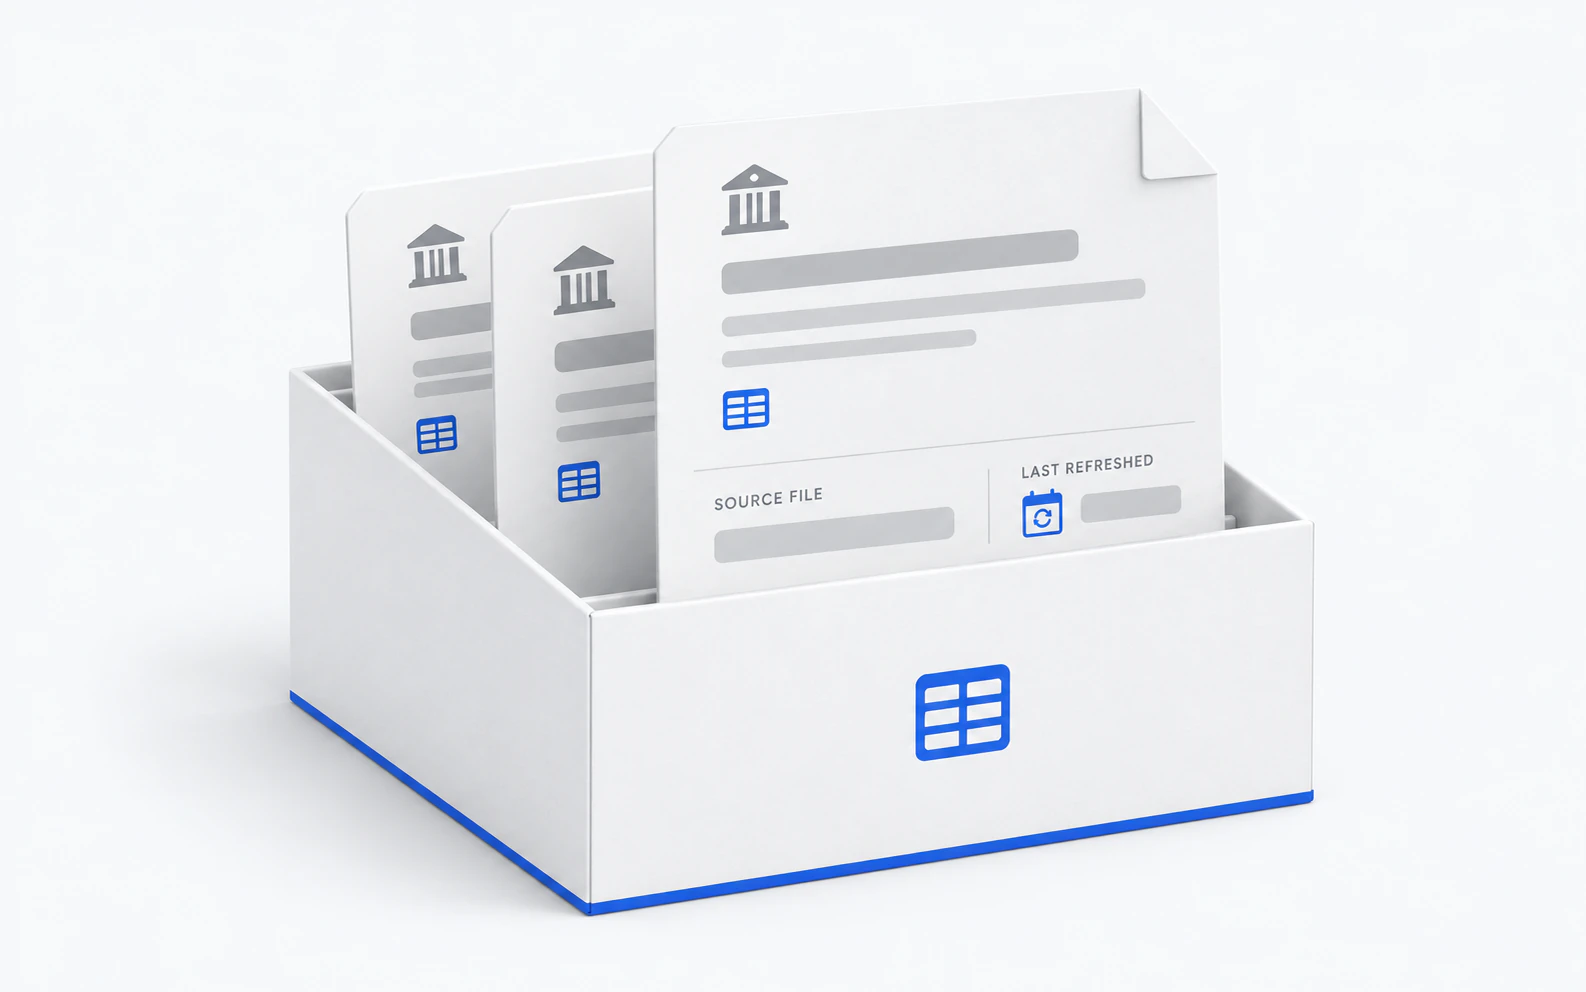
Every number traces back to its source file
QOPE reads the FDA Orange Book, Purple Book, openFDA shortages and enforcement reports, CMS NADAC, Medicare Part D and Part B and the Medicaid Drug Rebate Program. Each table shows its source and the date it was last refreshed.
Built for the teams that move when a market moves
Pick the next launch
Rank markets by exposure, whitespace and urgency, and see who already filed.
Defend the franchise
The brand-side view: which brands sit on naked cliffs and which are cushioned by exclusivity.
Size the revenue at risk
Part D spend in markets that open, contestability and what generics actually sell for.
Plan around shortages
Single-source gaps, manufacturer reliability and acquisition cost for every product.
Common questions
Where does the data come from?+
From the FDA Orange Book and Purple Book, openFDA drug shortages and enforcement reports, FDA drug labels, CMS NADAC, the Medicare Part D and Part B provider files and the Medicaid Drug Rebate Program.
Does the prescribing data cover every payer?+
No. Demand comes from the CMS Medicare Part D and Part B files, data year 2024, so it covers Medicare, not every payer.
How fresh is it?+
Every table shows the date its source was last refreshed. Radar checks watched drugs twice a day.
Can I get alerts by email?+
Yes, on Pro and Teams: instant alerts for time-sensitive changes and a weekly digest every Monday.
Is there a trial?+
Yes. Regular and Pro start with a 14-day trial. Sign up yourself, no sales call needed.
Type a drug. See its cliff, its competitors and its price in one page.
Radar email alerts are on Pro and Teams. Lower prices on annual plans.