Drug pricing in the United States is characterized by multiple reference prices, each serving a different purpose in the pharmaceutical supply chain. Wholesale Acquisition Cost (WAC), Average Sales Price (ASP), and Average Wholesale Price (AWP) represent distinct pricing benchmarks, sourced from different data providers and updated on different schedules. Understanding these pricing measures — and their fragmentation across public sources — is essential for market access strategy, reimbursement analysis, and competitive intelligence.
Three Pricing Benchmarks, Three Different Meanings
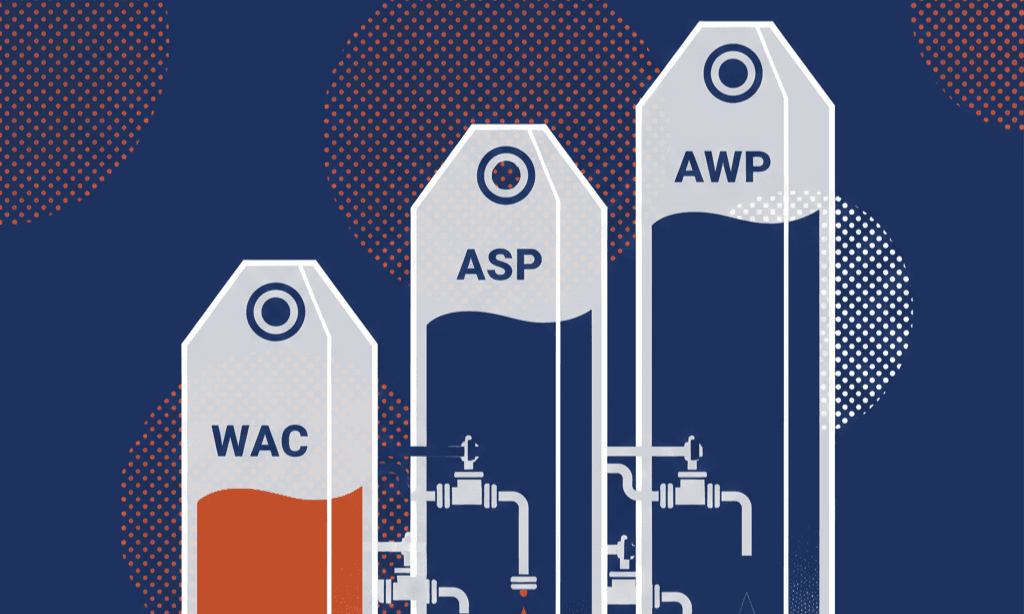
Wholesale Acquisition Cost (WAC) is the manufacturer's list price for a drug to wholesalers or direct purchasers, excluding discounts and rebates. WAC is often described as the "sticker price" and serves as a baseline for calculating other prices. Manufacturers report WAC to drug pricing compendia such as Medi-Span and First Databank. WAC does not reflect actual transaction prices, which are typically lower due to negotiated discounts.
Average Sales Price (ASP) represents the average price paid to manufacturers for drugs covered under Medicare Part B, net of rebates and discounts. ASP is calculated quarterly by manufacturers and reported to the Centers for Medicare & Medicaid Services (CMS). Medicare reimburses providers for Part B drugs at ASP plus a percentage (typically 6%), making ASP directly relevant to reimbursement. ASP is generally lower than WAC because it reflects post-discount pricing.
Average Wholesale Price (AWP) is a pricing benchmark historically used by pharmacy benefit managers, insurers, and Medicaid programs to calculate reimbursement. Despite its name, AWP does not represent actual wholesale prices — it is typically calculated as WAC plus a markup (often 20% for brand drugs). AWP is published by drug pricing compendia and is used primarily for contractual and reimbursement purposes. Legal settlements in the 2000s challenged AWP's accuracy, reducing its use in some contexts, but it remains widely referenced.
Why Pricing Data is Fragmented
Drug pricing data originates from multiple sources, each with different coverage, update frequencies, and access models:
Manufacturer-reported data: Manufacturers report WAC to commercial compendia and ASP to CMS. These submissions are not standardized across all drugs — reporting requirements vary by reimbursement pathway and product type.
CMS ASP files: CMS publishes quarterly ASP data for Medicare Part B drugs. These files are publicly available but cover only drugs reimbursed under Part B (primarily physician-administered drugs, not retail prescriptions). ASP data is reported with a two-quarter lag, meaning current prices reflect averages from months prior.
Commercial compendia: Companies like Medi-Span, First Databank, and Redbook maintain comprehensive drug pricing databases that include WAC, AWP, and package sizes. Access to these compendia typically requires licensing agreements. Coverage is broad, but updates depend on manufacturer submissions.
Medicaid drug pricing: The Medicaid Drug Rebate Program requires manufacturers to report Average Manufacturer Price (AMP) and Best Price to CMS. AMP is used to calculate Medicaid rebates but is not publicly disclosed for individual drugs, creating an information gap for market access analysts.
This fragmentation creates challenges. An analyst researching pricing for a specific drug may need to:
- Check CMS ASP files for Part B pricing
- License a commercial compendium for WAC and AWP
- Review manufacturer press releases for list price changes
- Estimate AMP using publicly available formulas (but without direct verification)
No single public source provides all pricing benchmarks for all drugs.
Temporal Inconsistencies and Update Lags
Pricing data updates occur on different schedules. WAC changes when manufacturers adjust list prices, which can happen at any time (though often in January). ASP is calculated quarterly and published with a lag — ASP for Q1 reflects actual sales from the prior quarter. AWP updates follow WAC changes but may not be immediate depending on compendium update cycles.
This temporal fragmentation complicates trend analysis. Comparing WAC and ASP for the same drug requires aligning data from different time periods and understanding that ASP reflects historical averages while WAC represents current list prices.
For drugs with frequent price changes or significant discount variability, this lag introduces uncertainty. A market access team evaluating reimbursement for a newly launched drug may have WAC data immediately but must wait months for ASP data based on actual sales.
Interpreting Pricing Relationships
The relationship between WAC, ASP, and AWP reveals market dynamics. When ASP is significantly lower than WAC, it indicates substantial discounting or rebating. This is common for competitive therapeutic categories where manufacturers offer discounts to gain formulary placement.
Drugs with minimal ASP-WAC spread may have limited competition, strong market exclusivity, or less aggressive discounting. Orphan drugs and highly specialized therapies often show smaller spreads.
AWP's relationship to WAC is typically formulaic (WAC + markup), but variations occur. Some drugs have AWP significantly above the standard markup, often for legacy reasons or contractual agreements.
These relationships are not advisory — they reflect market structure and pricing strategy but do not indicate whether a drug is "fairly priced" or "overpriced." Pricing benchmarks serve operational purposes (reimbursement calculations, contract terms) rather than normative judgments.
Use Cases for Structured Pricing Data
Organizations use multi-benchmark pricing data for several purposes:
- Reimbursement modeling: Payers model budget impact by comparing WAC (list price) to expected ASP (reimbursement basis). Large discrepancies indicate potential cost-containment opportunities through negotiations.
- Market access strategy: Manufacturers analyze competitor pricing across benchmarks to inform launch pricing and discount strategies. Understanding how competitors' ASP relates to WAC reveals discount intensity.
- Policy analysis: Researchers studying drug pricing trends aggregate ASP and WAC data over time to measure price inflation, launch pricing patterns, and market competition effects.
- Formulary management: Pharmacy benefit managers use WAC and AWP to structure tiered formularies and negotiate rebates.
These applications require access to historical pricing data, the ability to link pricing to other drug attributes (therapeutic class, approval date, competitors), and tools to calculate derived metrics (ASP/WAC ratios, price change trends).
Data Accessibility and Licensing
Public access to pricing data is limited. CMS ASP files are freely available but narrow in scope. Comprehensive pricing data requires licensing from commercial compendia, which involves subscription costs. This creates a barrier for smaller organizations, academic researchers, and startups.
Some manufacturers publish WAC in press releases or on websites, but this is inconsistent and not machine-readable. There is no central public repository for WAC across all drugs.
Structured pricing platforms aggregate data from multiple sources, standardize formats, and provide historical versioning. This infrastructure reduces the operational burden of accessing fragmented sources and enables systematic analysis.
Limitations of Public Pricing Data
Public pricing data reflects benchmarks, not actual transaction prices. Net prices — what payers ultimately pay after all discounts, rebates, and fees — are typically confidential and negotiated individually. WAC, ASP, and AWP provide reference points but do not reveal the full economic picture.
ASP data is subject to manufacturer reporting accuracy. CMS conducts audits, but errors or delays in reporting can affect ASP calculations.
Pricing for specialty drugs administered in outpatient settings, particularly those billed under medical benefits rather than pharmacy benefits, may not appear consistently in public pricing files.